This is the multi-page printable view of this section. Click here to print.
Monitoring and usage
- 1: Track user activity with audit logs
- 2: Use Prometheus monitoring
- 3: Configure Slack alerts
- 4: View organization activity
1 - Track user activity with audit logs
Use W&B audit logs to track user activity within your organization and to conform to your enterprise governance requirements. Audit logs are available in JSON format. Refer to Audit log schema.
How to access audit logs depends on your W&B platform deployment type:
| W&B Platform Deployment type | Audit logs access mechanism |
|---|---|
| Self-Managed | Synced to instance-level bucket every 10 minutes. Also available using the API. |
| Dedicated Cloud with secure storage connector (BYOB) | Synced to instance-level bucket (BYOB) every 10 minutes. Also available using the API. |
| Dedicated Cloud with W&B managed storage (without BYOB) | Available only by using the API. |
| Multi-tenant Cloud | Available for Enterprise plans only. Available only by using the API. |
After fetching audit logs, you can analyze them using tools like Pandas, Amazon Redshift, Google BigQuery, or Microsoft Fabric. Some audit log analysis tools do not support JSON; refer to the documentation for your analysis tool for guidelines and requirements for transforming the JSON-formatted audit logs before analysis.
Audit log retention
If you require audit logs to be retained for a specific period of time, W&B recommends periodically transferring logs to long-term storage, either using storage buckets or the Audit Logging API.
If you are subject to the Health Insurance Portability and Accountability Act of 1996 (HIPAA), audit logs must be retained for a minimum of 6 years in an environment where they cannot be deleted or modified by any internal or exterrnal actor before the end of the mandatory retention period. For HIPAA-compliant Dedicated Cloud instances with BYOB, you must configure guardrails for your managed storage, including any long-term retention storage.
Audit log schema
This table shows all keys which may appear in an audit log entry, ordered alphabetically. Depending on the action and the circumstances, a specific log entry may include only a subset of the possible fields.
| Key | Definition |
|---|---|
action |
The action of the event. |
actor_email |
The email address of the user that initiated the action, if applicable. |
actor_ip |
The IP address of the user that initiated the action. |
actor_user_id |
The ID of the logged-in user who performed the action, if applicable. |
artifact_asset |
The artifact ID associated with the action, if applicable. |
artifact_digest |
The artifact digest associated with the action, if applicable. |
artifact_qualified_name |
The full name of the artifact associated with the action, if applicable. |
artifact_sequence_asset |
The artifact sequence ID associated with the action, if applicable. |
cli_version |
The version of the Python SDK that initiated the action, if applicable. |
entity_asset |
The entity or team ID associated with the action, if applicable. |
entity_name |
The entity or team name associated with the action, if applicable. |
project_asset |
The project associated with the action, if applicable. |
project_name |
The name of the project associated with the action, if applicable. |
report_asset |
The report ID associated with the action, if applicable. |
report_name |
The name of the report associated with the action, if applicable. |
response_code |
The HTTP response code for the action, if applicable. |
timestamp |
The time of the event in RFC3339 format. For example, 2023-01-23T12:34:56Z represents January 23, 2023 at 12:34:56 UTC. |
user_asset |
The user asset the action impacts (rather than the user performing the action), if applicable. |
user_email |
The email address of the user the action impacts (rather than the email address of the user performing the action), if applicable. |
Personally identifiable information (PII)
Personally identifiable information (PII), such as email addresses and the names of projects, teams, and reports, is available only using the API endpoint option.
- For Self-Managed and Dedicated Cloud, an organization admin can exclude PII when fetching audit logs.
- For Multi-tenant Cloud, the API endpoint always returns relevant fields for audit logs, including PII. This is not configurable.
Fetch audit logs
An organization or instance admin can fetch the audit logs for a W&B instance using the Audit Logging API, at the endpoint audit_logs/.
-
If a user other than an admin attempts to fetch audit logs, a HTTP
403error occurs, indicating that access is denied. -
If you are an admin of multiple Enterprise Multi-tenant Cloud organizations, you must configure the organization where audit logging API requests are sent. Click your profile image, then click User Settings. The setting is named Default API organization.
-
Determine the correct API endpoint for your instance:
- Self-Managed:
<wandb-platform-url>/admin/audit_logs - Dedicated Cloud:
<wandb-platform-url>/admin/audit_logs - Multi-tenant Cloud (Enterprise required):
https://api.wandb.ai/audit_logs
In proceeding steps, replace
<API-endpoint>with your API endpoint. - Self-Managed:
-
Construct the full API endpoint from the base endpoint, and optionally include URL parameters:
-
anonymize: if set totrue, remove any PII; defaults tofalse. Refer to Exclude PII when fetching audit logs. Not supported for Multi-tenant Cloud. -
numDays: logs will be fetched starting fromtoday - numdaysto most recent; defaults to0, which returns logs only fortoday. For Multi-tenant Cloud, you can fetch audit logs from a maximum of 7 days in the past. -
startDate: an optional date with formatYYYY-MM-DD. Supported only on Multi-tenant Cloud.startDateandnumDaysinteract:- If you set both
startDateandnumDays, logs are returned fromstartDatetostartDate+numDays. - If you omit
startDatebut includenumDays, logs are returned fromtodaytonumDays. - If you set neither
startDatenornumDays, logs are returned fortodayonly.
- If you set both
-
-
Execute an HTTP
GETrequest on the constructed fully qualified API endpoint using a web browser or a tool like Postman, HTTPie, or cURL.
The API response contains new-line separated JSON objects. Objects will include the fields described in the schema, just like when audit logs are synced to an instance-level bucket. In those cases, the audit logs are located in the /wandb-audit-logs directory in your bucket.
Use basic authentication
To use basic authentication with your API key to access the audit logs API, set the HTTP request’s Authorization header to the string Basic followed by a space, then the base-64 encoded string in the format username:API-KEY. In other words, replace the username and API key with your values separated with a : character, then base-64-encode the result. For example, to authorize as demo:p@55w0rd, the header should be Authorization: Basic ZGVtbzpwQDU1dzByZA==.
Exclude PII when fetching audit logs
For Self-Managed and Dedicated Cloud, a W&B organization or instance admin can exclude PII when fetching audit logs. For Multi-tenant Cloud, the API endpoint always returns relevant fields for audit logs, including PII. This is not configurable.
To exclude PII, pass the anonymize=true URL parameter. For example, if your W&B instance URL is https://mycompany.wandb.io and you would like to get audit logs for user activity within the last week and exclude PII, use an API endpoint like:
https://mycompany.wandb.io/admin/audit_logs?numDays=7&anonymize=true.
Actions
This table describes possible actions that can be recorded by W&B, sorted alphabetically.
| Action | Definition |
|---|---|
artifact:create |
Artifact is created. |
artifact:delete |
Artifact is deleted. |
artifact:read |
Artifact is read. |
project:delete |
Project is deleted. |
project:read |
Project is read. |
report:read |
Report is read. 1 |
run:delete_many |
Batch of runs is deleted. |
run:delete |
Run is deleted. |
run:stop |
Run is stopped. |
run:undelete_many |
Batch of runs is restored from trash. |
run:update_many |
Batch of runs is updated. |
run:update |
Run is updated. |
sweep:create_agent |
Sweep agent is created. |
team:create_service_account |
Service account is created for the team. |
team:create |
Team is created. |
team:delete |
Team is deleted. |
team:invite_user |
User is invited to team. |
team:uninvite |
User or service account is uninvited from team. |
user:create_api_key |
API key for the user is created. 1 |
user:create |
User is created. 1 |
user:deactivate |
User is deactivated. 1 |
user:delete_api_key |
API key for the user is deleted. 1 |
user:initiate_login |
User initiates log in. 1 |
user:login |
User logs in. 1 |
user:logout |
User logs out. 1 |
user:permanently_delete |
User is permanently deleted. 1 |
user:reactivate |
User is reactivated. 1 |
user:read |
User profile is read. 1 |
user:update |
User is updated. 1 |
1: On Multi-tenant Cloud, audit logs are not collected for:
- Open or Public projects.
- The
report:readaction. Useractions which are not tied to a specific organization.
2 - Use Prometheus monitoring
Use Prometheus with W&B Server. Prometheus installs are exposed as a kubernetes ClusterIP service.
Follow the procedure below to access your Prometheus metrics endpoint (/metrics):
-
Connect to the cluster with Kubernetes CLI toolkit, kubectl. See kubernetes’ Accessing Clusters documentation for more information.
-
Find the internal address of the cluster with:
kubectl describe svc prometheus -
Start a shell session inside your container running in your Kubernetes cluster with
kubectl exec. Hit the endpoint at<internal address>/metrics.Copy the command below and execute it in your terminal and replace
<internal address>with your internal address:kubectl exec <internal address>/metrics
A test pod starts, which you can exec into just to access anything in the network:
kubectl run -it testpod --image=alpine bin/ash --restart=Never --rm
From there you can choose to keep access internal to the network or expose it yourself with a kubernetes nodeport service.
3 - Configure Slack alerts
Integrate W&B Server with Slack.
Create the Slack application
Follow the procedure below to create a Slack application.
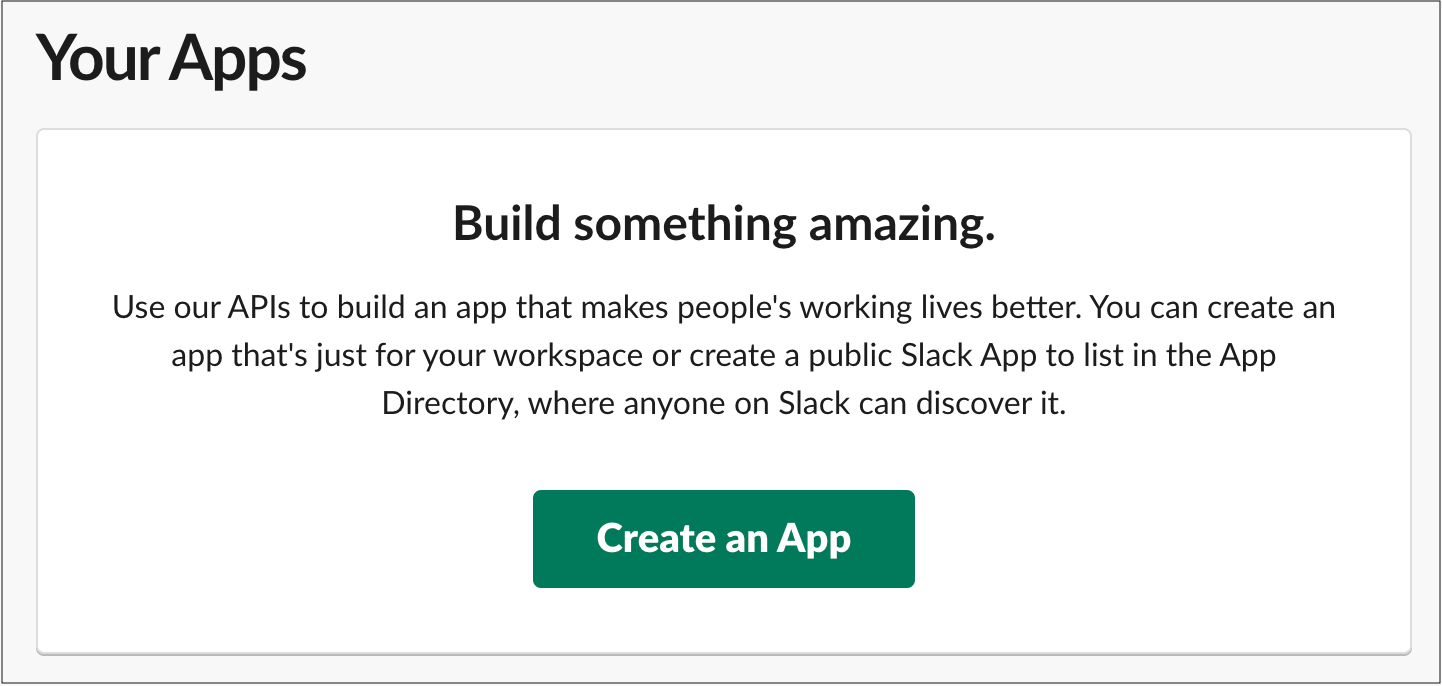
-
Visit https://api.slack.com/apps and select Create an App.
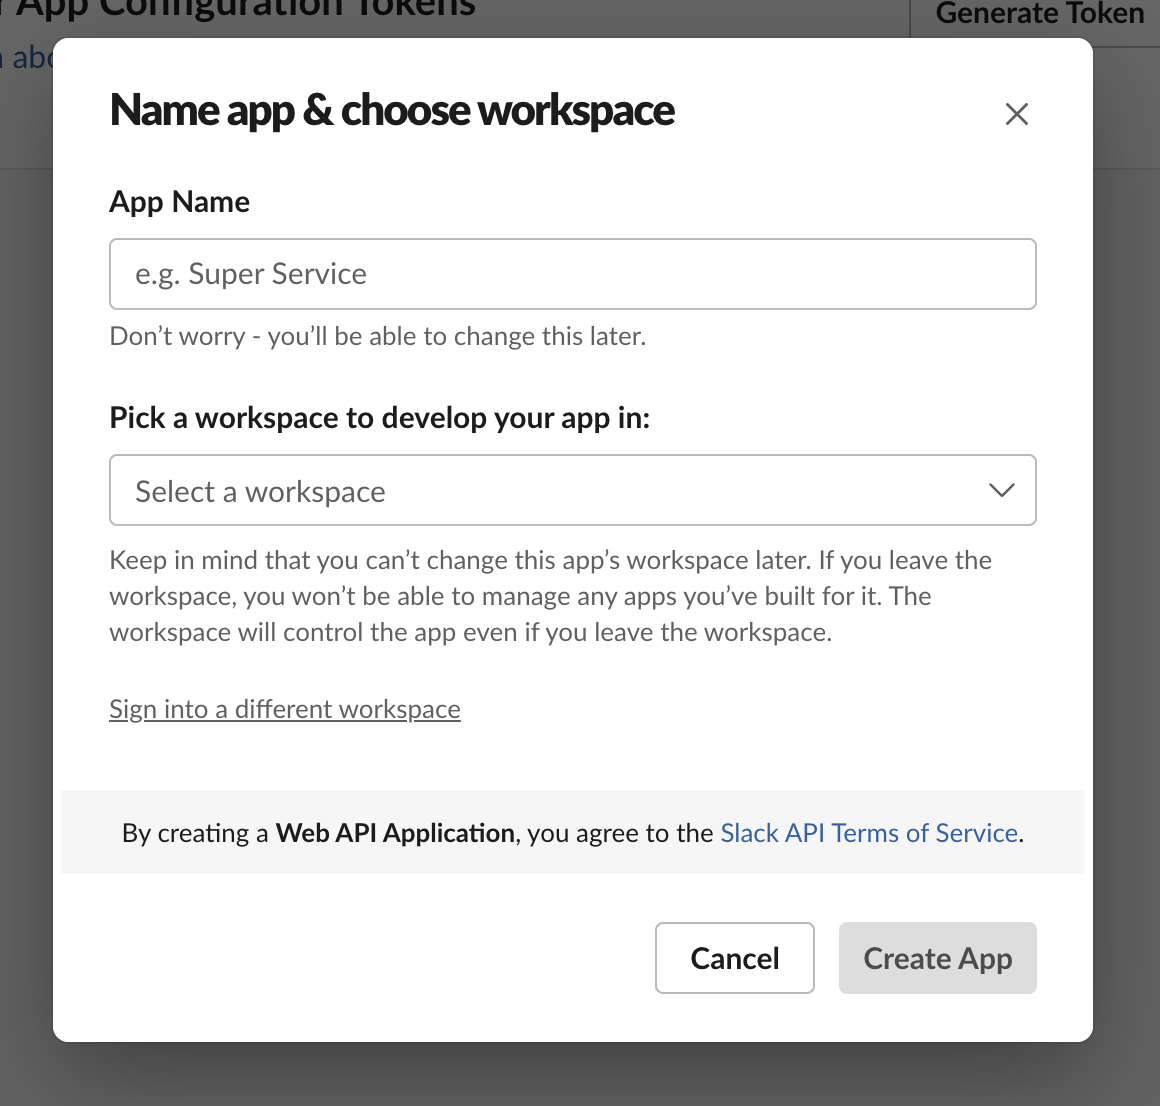
-
Provide a name for your app in the App Name field.
-
Select a Slack workspace where you want to develop your app in. Ensure that the Slack workspace you use is the same workspace you intend to use for alerts.
Configure the Slack application
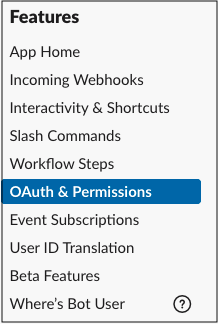
-
On the left sidebar, select OAth & Permissions.
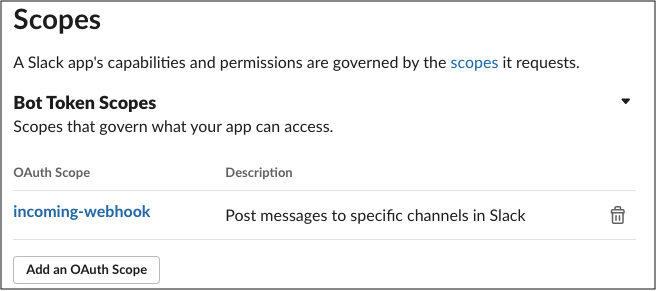
-
Within the Scopes section, provide the bot with the incoming_webhook scope. Scopes give your app permission to perform actions in your development workspace.
For more information about OAuth scopes for Bots, see the Understanding OAuth scopes for Bots tutorial in the Slack API documentation.
-
Configure the Redirect URL to point to your W&B installation. Use the same URL that your host URL is set to in your local system settings. You can specify multiple URLs if you have different DNS mappings to your instance.
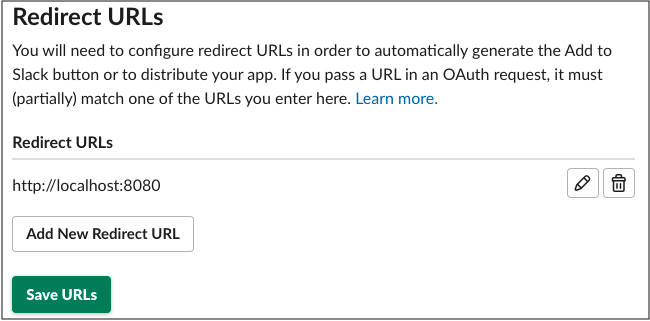
-
Select Save URLs.
-
You can optionally specify an IP range under Restrict API Token Usage, allow-list the IP or IP range of your W&B instances. Limiting the allowed IP address helps further secure your Slack application.
Register your Slack application with W&B
-
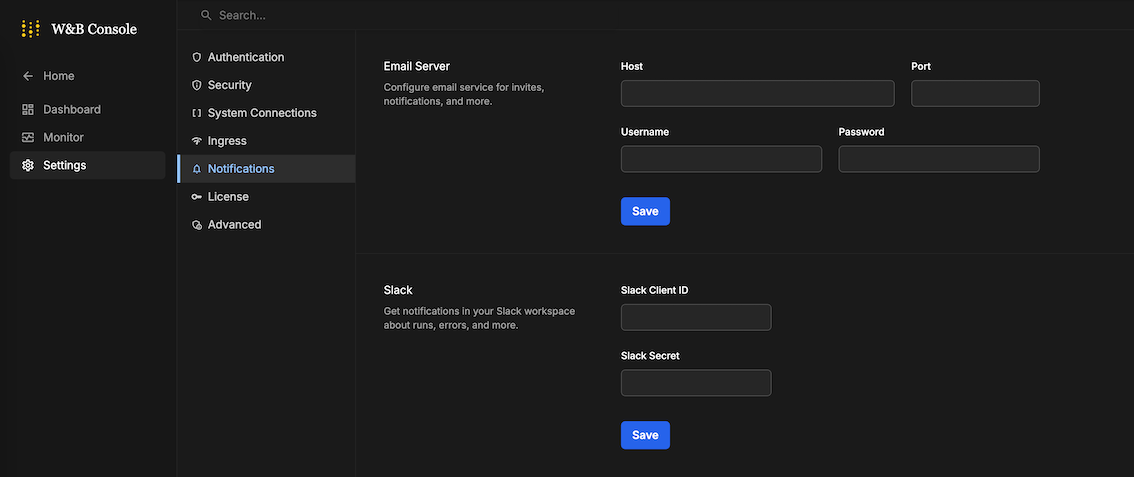
Navigate to the System Settings or System Console page of your W&B instance, depending on your deployment
-
Depending on the System page you are on follow one of the below options:
-
If you are in the System Console: go to Settings then to Notifications
-
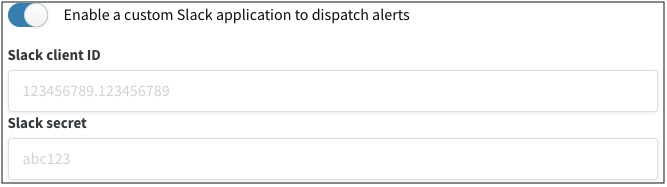
If you are in the System Settings: toggle the Enable a custom Slack application to dispatch alerts to enable a custom Slack application
-
-
Supply your Slack client ID and Slack secret then click Save. Navigate to Basic Information in Settings to find your application’s client ID and secret.
-
Verify that everything is working by setting up a Slack integration in the W&B app.
4 - View organization activity
This page shows various ways to view activity within your W&B organization.
View user status and activity
-
To access the Organization Dashboard, navigate to
https://<org-name>.io/org/dashboard/. Replace<org-name>with your organization name. The Users tab opens by default. It lists all users, along with data about each user. -
To sort the list by user status, click the Last Active column label. Each user’s status is one of the following:
- Invite pending: Admin has sent invite but user has not accepted invitation.
- Active: User has accepted the invite and created an account.
- -: The user was previously active but has not been active in the last 6 months.
- Deactivated: Admin has revoked access of the user.
-
To see details about a user’s last activity, hover your mouse over the Last Active field for the user. A tooltip appears that shows when the user was added and how many total days the user has been active.
A user is active if they:
- log in to W&B.
- view any page in the W&B App.
- log runs.
- use the SDK to track an experiment.
- interact with the W&B Server in any way.
-
Navigate to the Members page. This page lists all users, along with data about each user.
-
To sort the list by user status, click the Last Active column label. Each user’s status is one of the following:
- Invite pending: Admin has sent invite but user has not accepted invitation.
- Active: User has accepted the invite and created an account.
-: A hyphen indicates that the user has not yet been active within the organization.
A user is active if they perform any auditable action scoped to the organization after May 8, 2025. For a full list, refer to Actions in the Audit Logging page.
Export user details
From the Users tab, you can export details about how your organization uses W&B in CSV format.
- Navigate to the Organization Dashboard at
https://<org-name>.io/org/dashboard/. Replace<org-name>with your organization name. The Users tab opens by default. - Click the action
...menu next to the Invite new user user button. - Click Export as CSV. The downloaded CSV file lists details about each user of an organization, such as their user name and email address, the time they were last active, their roles, and more.
Exporting users is not available for Multi-tenant Cloud.
View activity over time
This section shows how to get an aggregate view of activity over time.
Use the plots in the Activity tab to get an aggregate view of how many users have been active over time.
- To access the Organization Dashboard, navigate to
https://<org-name>.io/org/dashboard/. Replace<org-name>with your organization name. - Click the Activity tab.
- The Total active users plot shows how many unique users have been active in a period of time (defaults to 3 months).
- The Users active over time plot shows the fluctuation of active users over a period of time (defaults to 6 months). Hover your mouse over a pointo to see the number of users on that date.
To change the period of time for a plot, use the drop-down. You can select:
- Last 30 days
- Last 3 months
- Last 6 months
- Last 12 months
- All time
Use the plots in the Activity Dashboard to get an aggregate view of activity over time:
- Click the user profile icon at the top right.
- Under Account, click Users.
- View the Activity Panel above the list of users. It shows:
- The Active user count badge shows how many unique users have been active in a period of time (defaults to 3 months). A user is active if they perform any auditable action scoped to the organization. For a full list, refer to Actions in the Audit Logging page.
- The Weekly active users plot shows the number of users active per week.
- The Most active user leaderboard ranks the top ten most active users by how many days they were active over the period of time, as well as when they were most recently active.
- To adjust the span of time the plots show, click the date picker in the top right. You can choose 7, 30, or 90 days. The default date range is 30 days. All of the plots share the same time range and update automatically.